- Type:
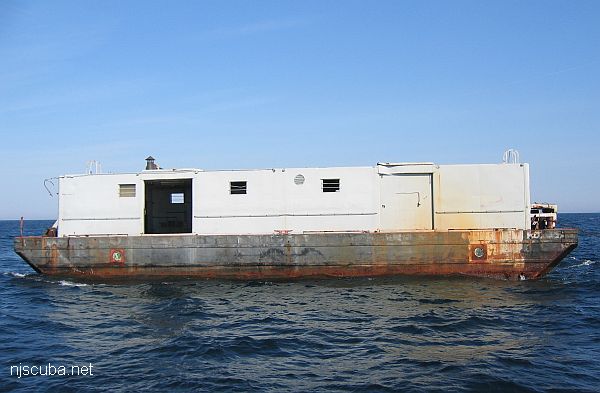
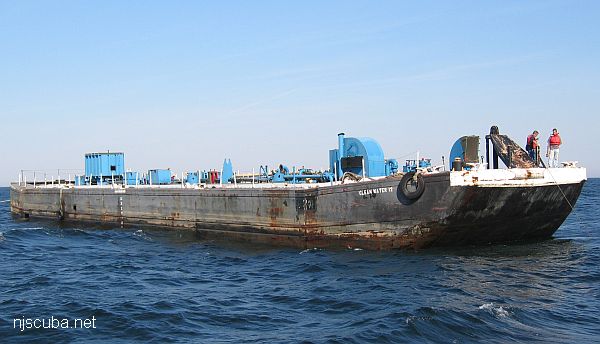
- artificial reef, barge
- Built:
- 1961, Bethlehem Beaumont, Beaumont TX USA
- Specs:
- ( 230 ft )
- Sponsor:
- Morania Oil Company
- Sunk:
- Monday June 6, 1988 - Sea Girt Artificial Reef
- GPS:
- 40°06.301' -73°57.424'
- Depth:
- 75 ft
More: Morania 180 ...
More: Morania 180 ...
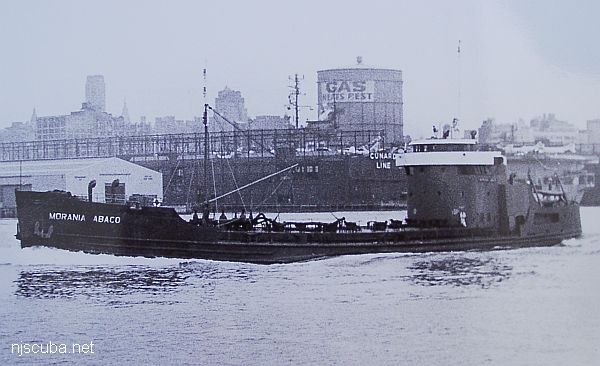
More: Morania Abaco ...
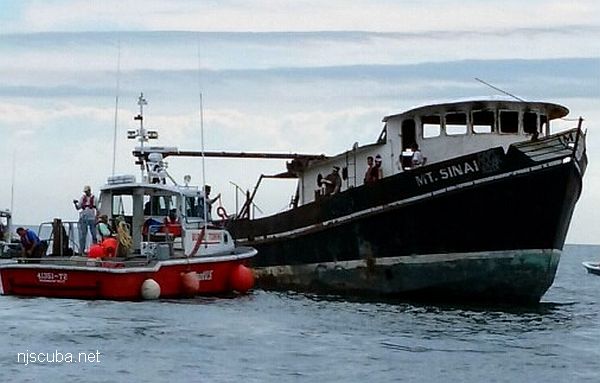
More: Mount Sinai ...
More: Mr G / Rusty Pusher ...
More: MRMTC 8 ...
More: MRMTC 9 ...
More: New England Coast ...
Artificial Reefs
The charts on this site have always been a pain to update. Starting with a spreadsheet of coordinates, converting DMS to decimal and then to pixel coordinates, then precisely placing markers in an image editor. Then generating a corresponding html image map for the links, and putting the whole thing in WordPress in such a way that WordPress doesn't simply eat it, as it is prone to do with a lot of things.
More: New Reef Charts ...
More: Niagara Falls ...
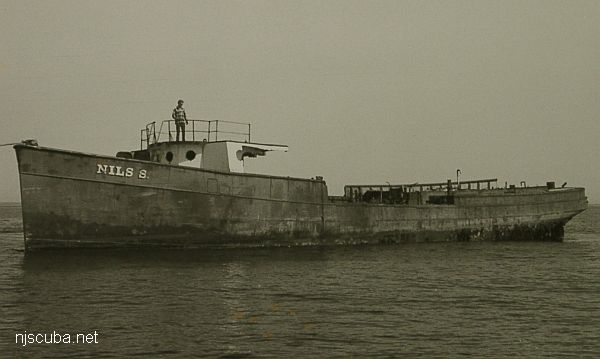
More: Nils S ...
More: Edward H Cole ...