Decompression Theory (2/2)
You can make neat colorful graphs of nitrogen loading curves, so here we go ...
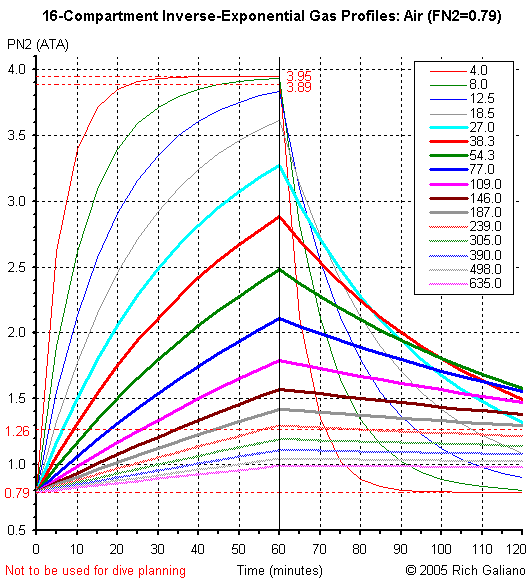
- At time = 0, ambient pressure is instantaneously increased from 1 ATA to 5 ATA.
( or 130ft, PN2 = 3.95 ATA ) - At time = 60, ambient pressure is instantaneously reduced back to 1 ATA (surface)
- This is obviously not possible in real life, but is suitable for purposes of exposition.
If this was a real dive profile, it would kill you in more ways than one !
From the gas loading curves, it is apparent that the four "fastest" compartments ( 4.0 - 18.5, thin lines ) become largely or completely saturated, and that they also unload very quickly, such that after one hour of off-gassing, they are all back within the "safe" pressure ratio of 1.6:1 ( equal to 1.26:0.79 at the surface. )
The five slowest compartments ( 239.0 - 635.0, stippled lines ) pick up so little nitrogen loading that even at t=60 they have not achieved a pressure ratio of 1.6:1 with respect to surface pressure. They would therefore seem to present little concern for decompression in this example.
However, the seven middle compartments ( 27.0 - 187.0, heavy lines ) all become significantly nitrogen-loaded, and off-gas slowly enough that even at the end-time of this plot ( t=120 ) they all still contain more than the "safe" pressure ratio of 1.6:1. In Buhlmann's model of decompression, it is typically these compartments that control decompression schedules for real-world dive profiles.
Typically, in real decompression schedules, the fast compartments off-gas well within the times required for the middle compartments, while the slow compartments seldom enter into the equation. Perhaps less intuitive is the fact that the heavily-loaded fast compartments may still influence the early part of an extended decompression schedule ( "deep stops" ) before yielding control to the middle compartments. Slow compartments may affect "time to fly" considerations.
It is also worth noting that off-gassing is a much slower process than on-gassing, as evidenced by the fact that after an equal time of on-gassing and off-gassing, only the two fastest compartments have returned to their original state; all others still contain significant nitrogen loads.
One might also conclude from this presentation that short "bounce dives" of around 5 minutes duration should be relatively safe, since only the fast compartments acquire any significant nitrogen loading, and this can be off-loaded with a brief deco stop or even just a slow ascent. Alas, that is not the case though, as real-life is a lot more complicated than this simple plot.

What would the nitrogen pressure curves look like for a more realistic dive profile? Above is a profile taken directly from the PADI Recreational Dive Planner: 100 ft for 19 minutes, with a 5-minute safety stop at 15 ft. Ascents and descents are crudely modeled in 1 ATA steps. It becomes clear from this plot that for relatively short, no-decompression dives, the very long compartments of Buhlmann's model are essentially irrelevant - they never reach a high enough pressure to matter. PADI came to this conclusion as well: their model is based on 7 tissue compartments with half-times from 5 to 120 minutes.
Another point here concerns surface intervals. After 30 minutes, or t=60, several compartments still show significant nitrogen loading. After about 60 minutes, or t=90, all have dropped down to fairly low levels, with little improvement at 90 minutes ( t=120 ). This would suggest that a surface interval of around 60 minutes is optimal; shorter is not enough, and much longer is simply a waste of time.

A quick calculation of pressure ratios will demonstrate that according to this graph, the diver will leave the water with a worst-case pressure ratio of about 2.0, or probably bent. That just goes to show that decompression modeling is much more complex than what is depicted in these crude graphs. The PADI RDP has a proven track record of safety. PADI, the US Navy, and others went through reams of real-life data, tweaking, adjusting, testing, and retesting their models. They didn't just crank out a few simplified equations and call it a day, as I have here.
Most dive computers that utilize Haldane's method use nine to twelve tissue compartments, rather than the full 16 of Buhlmann's model. There are a number of other decompression models besides Haldane's. Some are quite complex and curious. Bubble models concentrate on the physical formation and growth of gas bubbles, while the latest Navy method takes a purely statistics-based approach, and makes no attempt to model any physical process at all. In the end, though, they all share one thing: they all tweaked to fit real-world data on scuba diving. Is one model better than another? Given that they all "cheat" in the end to get the right answer, I would say probably not.
Decompression Theory 3
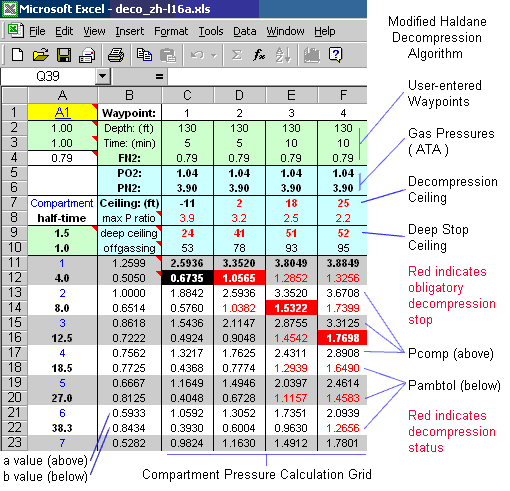
There is nothing mystical about decompression theory. In fact, it is all rather straightforward. For example, here is the Buhlmann ZH-L16A decompression algorithm ( er, I mean the Modified Haldane algorithm; see below ) as described previously, implemented in Microsoft Excel. In addition, versions B and C of the algorithm are also presented.
Warning:
This software should not be used for the planning of actual dives ! This implementation of the modified Haldanean decompression algorithm is extremely rudimentary and is suitable for educational purposes only.
This software has received no scientific testing or validation. This software may contain bugs, and the figures which it outputs may be erroneous. The schedules which it generates are simply the results of mathematical calculations which do not in any way represent the mechanics of the human body. Do not use this software in situations where failure of the software may lead to illness, injury or death. The designers of this software accept no responsibility for illness, injury, loss or death of the user or any third party.
Note: This spreadsheet is done in an old version of Excel that I no longer have. If you want to play with it, I cannot help you.
User-enterable dive waypoints and conservatism factors make up the green cells in the sheet. Each waypoint triplet represents a segment of a dive:
- depth ( feet, bold red indicates decompression violation )
- time at depth ( minutes )
- fraction of Nitrogen in the breathing gas ( 0.79 = air )
Fill in your dive profile starting with waypoint 1 and using as many as you need. Unused waypoints can be cleared. All dives are assumed to begin at sea level and breathing air ( FN2 = 0.79 ) and are assumed to be conducted in saltwater.
Cells A2 and A3 are user-enterable scale factors for the a and b values. Entering values less than 1.00 here will cause the allowable pressure calculations to back off from the theoretical limits, making the algorithm more conservative. The default values are 1.00 - least conservative. Cell A9 is the maximum deep-stop pressure ratio. Cell A10 is a dummy - you can use it for a dive sequence number if you like.
The blue cells show the cumulative results of the previous and current waypoints:
- PN2 and PO2 are the partial pressures of oxygen and nitrogen at the current depth and gas mix. This is not strictly part of the algorithm, but is presented to assist in selection of Nitrox mixes.
- Ceilingor the minimum depth that can be ascended to at the next waypoint. Negative ceilings are above sea level (see below.)
- Max P ratio is the worst-case compartment pressure ratio that would result from ascending to the ceiling depth.
- Deep Ceiling is the deep-stop decompression ceiling at the end of the current waypoint, based on the limiting pressure ratio selected in cell A9.
- Offgassing is the minimum depth at which at least one tissue compartment is off-gassing, even if others may still be on-gassing.
Below each waypoint is the column of calculations for the theoretical tissue compartments. For each compartment, the partial pressure of nitrogen is shown above, and the minimum tolerable ambient pressure is shown below. Results displayed in red indicate that decompression will be required at the next waypoint. The maximum values for each column are bolded, while the controlling compartment for each waypoint is picked out with reverse colors.
The formatting of the intermediate calculations allows the internal workings of the algorithm to be easily inspected. Changes in compartment pressures at each waypoint are displayed, and the shifting of the controlling compartment is visually obvious, especially when long-duration dives or surface intervals are broken up into short equal-depth waypoints.
Pulmonary Oxygen Toxicity units ( OTU, at the bottom of the sheet ) is not part of the decompression algorithm but is a simple calculation that is easy to implement in the spreadsheet, and so is included here as an afterthought. BSAC recommends limiting oxygen exposure to 800 OTU / day. CNS oxygen toxicity is not calculated.
Example:
The spreadsheet is already "seeded" with some interesting waypoint data. The waypoints are as follows:
| Waypoints 1-5: | An outlandish decompression dive to 130 feet for 50 minutes on air. This is broken up into five segments to show the on-gassing of the 16 compartments over time. |
| Waypoints 6-8: | Voluntary deep stops at 60 and 50 feet on air for two minutes each. Note that by the regular deco algorithm, an ascent directly to 40 feet is allowed, but this would incur a very high worst-case compartment pressure ratio, and should therefore be avoided. |
| Waypoint 8: | Obligatory decompression stop at 40 feet for two minutes on air. |
| Waypoints 9-11: | Obligatory decompression stops at 30, 20, & 10 feet for a total of 29 minutes, on 80% O2 Nitrox decompression mix. Note that these stops are following the "normal" decompression ceiling rather than the deep stop ceiling. |
| Waypoint 12: | Surface interval of 2 hours |
| Waypoint 13: | A no-decompression dive to 90 feet for 40 minutes on EAN36 or 36% Nitrox |
| Waypoint 14: | Five-minute safety stop at 15 feet on EAN36 |
| Waypoint 15: | 24-hour time-to-fly interval |
| Waypoint 16: | 2 1/2 hour airplane flight at a cabin pressure of 8000 feet ( typical airliner ) |
Following the usual practice, the obligatory deco stops ( waypoints 8-11 ) are rounded up to the next ten-foot depth. Therefore, a decompression ceiling of 30 feet at waypoint 7 results in a decompression stop of 40 feet. for waypoint 8. The time at waypoint 8 is then adjusted to result in the deepest possible ceiling above 30 feet, the next intended deco stop. This process is continued until the ceiling becomes 0 or negative, at which point it is safe to ascend to the surface. One could also follow the deep-stop schedule all the way to the surface, but that would take much longer.
You may notice that the 50 foot stop slightly violates the deep stop requirements, and really should be three minutes instead of two. However, making all the deep stops the same is a nice simplification for the real dive. You could just as well make all the deep stops three minutes for added conservatism, or 2-3-2 if you are really fussy, but in my opinion that would be placing a great deal of weight on the precision and accuracy of a model that is inherently rough at best. Perhaps the real point of all this is to show that good common sense and understanding are more important than blind reliance on any mathematical model, whether it is this one or the one in your dive computer!
Deep Stops
Recall that Haldane originally postulated that a "compartment" could undergo a pressure reduction of 50% without bubbling, or a pressure ratio of 2:1, which was later revised down to 1.6. Therefore the limiting pressure ratio of 1.5 (cell A9) for the deep-ceiling calculations is somewhat conservative. Note that many of the maximum pressure ratio values are considerably greater than this: a fast ascent to the theoretical ceiling depth of two feet at waypoint three would result in a worst-case compartment pressure ratio of 3.2 - approximately the same as a can of soda ( that's pop, for you midwesterners. ) and would very likely result in arterial bubbling and bends, even though it is completely within the accepted decompression model!
The purely mathematical ZH-L16A algorithm was found to be inadequate for real-world use, and so was developed into the more conservative ZH-L16B and ZH-L16C algorithms, which are also presented. ZH-L16B was developed for dive table calculations by empirically tweaking some of the a-values. ZH-L16C was developed in the same way for use in real-time dive computers and is more conservative again.
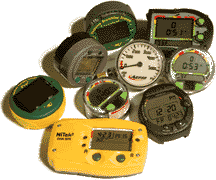
As you can see, the spreadsheet does pretty much everything your dive computer can do, and then some. Nitrox is automatically handled, as are repetitive dives, gas switches, user-selectable conservatism, and high altitude diving. However, rather than giving you a complete decompression schedule for your dive, the spreadsheet merely indicates the ceiling for the next waypoint, based on the allowable overpressure of the current waypoint. This can be used to work out a staged decompression schedule by hand, as I have done in the example. Similarly, the user may incorporate waypoints for deep stops, air breaks, surface intervals, and even time-to-fly.
Ascents and descents are assumed to be instantaneous - not very realistic. These could instead be modeled using very short waypoints at intermediate depths. A real dive computer probably computes a new waypoint several times a minute, and so automatically handles transients like this. You could do the same in the spreadsheet, but it would use up the available waypoints pretty quickly.
In fact, there is no reason that the spreadsheet could not have hundreds of waypoints, except that it would become very large and difficult to display, and sixteen points is more than enough for expositional purposes. A much more efficient way of handling hundreds or thousands of waypoints would be to only retain the result of the last set of calculations, as a real dive computer would do. This sort of dynamic programming could be implemented in the spreadsheet as well, using a macro. But that would defeat the purpose of this entire exercise, which is to display the inner workings of the decompression algorithm. Trimix would be handled similarly, and I have done it also, but I will not go into the details.
For simplicity, all dive profiles are assumed to begin at sea level breathing air, although altitude diving would be easy to implement. In fact, you can do this yourself by setting the first waypoint to the desired altitude for a very long time ( 10,000 minutes should do the trick. ) then just make sure your last waypoint will allow you to ascend to the same altitude. Altitudes above sea level are expressed in feet of water here:
+1000 feet of air = approximately -1 foot of water.
Try setting up some dive profiles of your own, and compare them with dive tables and your own computer. Set up profiles and surface intervals in increments, and watch how the controlling compartment changes during on-gassing and off-gassing. The profiles you generate here will probably be less conservative than what you will get from a real dive table but should be in the ballpark. And as I said -
DO NOT USE THESE RESULTS FOR REAL DIVE PLANNING !
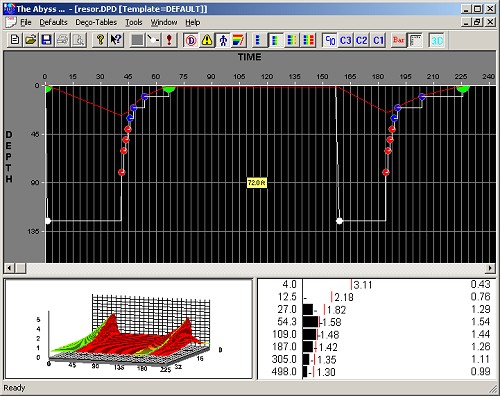
thankfully, this dangerous POS is no longer available
Buhlmann's is the simplest decompression algorithm, based on Haldane's ideas. For copyright reasons, most dive software and computers claim to use a Modified Haldane model, which is in fact modified to be Buhlmann's. There are other decompression algorithms as well, such as VPM ( Variable Permeability Model ) and RGBM ( Reduced Gradient Bubble Model. ) these algorithms model decompression based on bubble formation, and are much more complex and computationally intensive than Buhlmann's. If you would like to try one of these, I suggest V-Planner, which is a free download.
The interesting thing is that all these algorithms, regardless of exactly what they are modeling, generate surprisingly similar schedules, which in the end must all agree with the same empirical data. In fact, most algorithms, including the one shown, are actually tweaked to agree with the empirical data. Some people will dicker over minor variations, but the truth is that decompression calculations are imprecise by nature, and real-world decompression is subject to many other factors, many of which are simply unpredictable.
It is my own feeling that the apparent precision of each algorithm, and the small differences between them, are completely overwhelmed by random real-world factors. This renders the choice of algorithm inconsequential and makes them all somewhat suspect. It is far too easy to look at the complexity of any calculation, and the number of decimal places that a modern computer will carry and display, and get the impression that the result is extremely accurate when in fact it is not.
The term "undeserved hit" is used to describe cases where a diver did nothing wrong, whether it be by tables or their dive computer, and got bent anyway. Such things happen, and always will. In the end, decompression is still a statistical science, and no model is 100% correct. Given all the unknowns and uncertainties, the best way to be safe is to keep the modeling simple and the calculations error-free and dive the resulting schedules conservatively, with voluntary deep stops and extended hang times, especially at the shallow end.
I have also developed a version of this spreadsheet for Trimix, Heliox, and other mixes. That algorithm is computationally much more complex, requiring four interlinked sheets where the Nitrox/Air version used only one. Building this complexity into a dive computer is clearly no easy task - the majority of Trimix dive computers that have been released over the years have proven to be buggy if not outright flawed. I myself would not trust one.

