Marine Life Colonization of Experimental Reef Habitat (3/5)
RESULTS
Nomenclature
The taxonomic classification and common and scientific nomenclature of marine life identified in this study are presented in Table 2.
Table 2
Mean abundance and biomass per m2 of species colonizing 15 experimental reef habitats after 24 - 96 months on the seafloor.
Sample Size
Between 1998 and 2004, 15 experimental reef habitats were retrieved and analyzed as follows:
| Year | Number of Units |
| 1998 | 1 |
| 1999 | 3 |
| 2000 | 3 |
| 2001 | 3 |
| 2002 | 2 |
| 2003 | 3 |
| 2004 | 3 |
These 15 units contained a total of 118 colonization plates including rock, concrete, steel and rubber. The plates were also separated into two treatments - inside and outside the mesh box. The numbers of plates sampled by material and treatment are as follows:
| Material | Inside | Outside |
| Rock | 15 | 14 |
| Concrete | 14 | 15 |
| Steel | 15 | 15 |
| Rubber | 15 | 15 |
For comparative purposes with other studies, the results concerning both the entire unit and the colonization plates were expanded to a m2 base. In the case of the entire unit, results were extrapolated to a m2 of sea floor footprint. For colonization plates, results were extrapolated to a m2 of surface area. The expansion factors used to extrapolate survey findings to the appropriate m2 base are as follows:
| Habitat Component | Expansion Factor (Range) | |
| Experimental habitat Colonization plates: | 8.4-10.1 | |
| Rock | 21.7-57.1 | |
| Concrete | 14.4-21.8 | |
| Steel | 24.4-26.9 | |
| Rubber | 29.2-45.7 |
Species Diversity
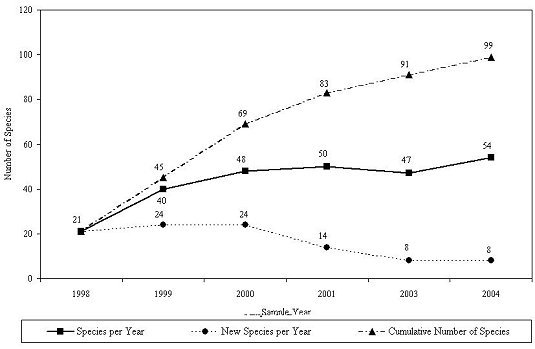
During the 96-month study, a total of 145 different taxa were identified on the experimental reef units (Table 2; Figure 17). All of the phyla encountered were from the Kingdom Animalia; no plant taxa were observed on the experimental habitats. A total of 126 genera (Figure 18) and 99 species (Figure 19) were identified. The taxa included representatives from 9 phyla. In terms of identified taxa, the most diverse phyla included molluska (43), arthropoda (42), and annelida (37) (Table 2). The habitats included 7 colonial and 138 individual-organism taxa; 50 sessile and 95 mobile (1 unknown) taxa; and 9 vertebrate and 136 invertebrate taxa. There were 46 taxa strongly associated with sediments that were probably present in the experimental habitats due to their subsidence into the sandy sea floor; these taxa included 21 molluska, 14 arthropoda, 8 annelida, 1 cnidaria, 1 echinodermata and 1 nemata.

Between 1998 and 2004, the number of taxa identified on the experimental reef habitats rose from 39 to 145 (Figure 17).Although the absolute number of taxa identified throughout the survey continues to rise, the number of new taxa discovered each year declined after 1999. New taxa are generally represented by a small number of individuals that provide community diversity, but do not constitute a significant portion of the overall community biomass. The slope of the curve suggests that only a small number of new taxa will be identified over the next few years on the experimental reef habitats.
Abundance and Biomass
During the 96-month study, the mean abundance and biomass of marine life inhabiting 15 experimental reef habitats are summarized in Table 2. The abundance of colonial species was measured in terms of surface area coverage; the mean coverage of all colonial species amounted to 87,564 + 8,446 (SE) cm2 per m2 of unit footprint. Individual organisms were counted; the mean abundance of individual organisms was 534,567 + 109,191 per m2. Over the course of the 96-month survey, only 2 taxa (blue mussel and skeleton shrimp) numbered more than 100,000 individuals (Table 3). Only 35 percent of the taxa were represented by more than 100 individuals per m2.
Table 3
The relative mean abundance of individual organisms by taxa per m2 footprint of experimental reef habitat during 1998 - 2004. This table does not include colonial organisms.
| Log of Abundance per m2 | Range | Number of Taxa | Percentage |
| -1 | 0.1 - 0.9 | 12 | 9 |
| 0 | 1 - 9 | 32 | 23 |
| 1 | 10 - 99 | 46 | 33 |
| 2 | 100 - 999 | 24 | 17 |
| 3 | 1,000 - 9,999 | 16 | 12 |
| 4 | 10,000 - 99,999 | 7 | 5 |
| 5 | 100,000 + | 2 | 1 |

The mean total damp weight biomass of all marine life averaged 84,175 + 11,992 g per m2 of experimental reef habitat footprint over the course of the survey. Molluska was the dominant phylum, representing 66.8 percent of the total unit biomass, followed by arthropoda (15.0 percent) and cnidaria (9.3 percent) (Figure 20). Other important phyla included ectoprocta (2.0 percent), annelida (3.0 percent), echinodermata (2.7 percent) and chordata (1.2 percent). Nemata and porifera represented a combined total of less than 0.1 percent of the overall biomass.
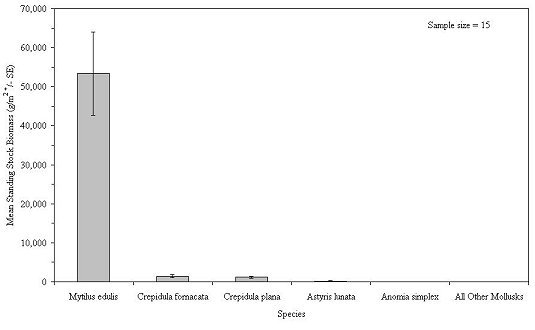
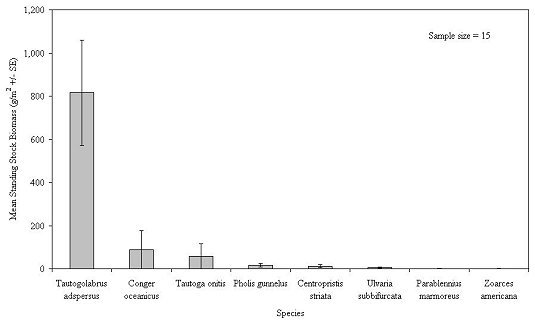
For molluska, blue mussel was by far the dominant species in terms of biomass, followed by two species of slipper shells (Figure 21). The arthropoda were dominated by a sessile genus, barnacle, and a mobile species, Jonah crab ( Cancer borealis) (Figure 22). Although 9 species of fish were captured on the habitats, cunner ( Tautogolabrus adspersus) was by far the most numerous and comprised the greatest combined biomass (Figure 23). During all sampling years combined, the mean number of fish was 105.7 + 9.6 per m2. This number included only small fish, less than 165 mm in TL, that were able to swim through the 2.5 cm square mesh. Most of these were juvenile fish. The actual number of small fish inhabiting the experimental habitats may be much greater, since some fish congregating outside the unit may have been scared away by the divers. Divers observed large, adult fish retreat from around the experimental habitats at their approach. Food and game species included black sea bass ( Centropristis striata), with a mean abundance of 3.1 fish per m2, tautog ( Tautoga onitis) at 0.6 fish/m2 and ocean pout ( Macrozoarces americanus) at 1.3 fish/m2 (Table 2).


Arthropoda are important forage species for marine food and gamefish. The mean abundance of arthropoda was 198,867 + 72,651 individuals per m2 of unit footprint. Ten species of crab accounted for a mean of 4,639 + 1,054 individuals per m2. All life stages of crabs, from megalops larvae to adults, were present within the units. Some Jonah and rock crabs ( Cancer irradians) had grown so large (over 40 mm carapace width) that they could not pass through the mesh and spent their entire lives inside the small, experimental habitats. The small cavities within the units provided escape cover for juvenile American lobster, which had a mean abundance of 14.9 + 3.7 individuals per m2.
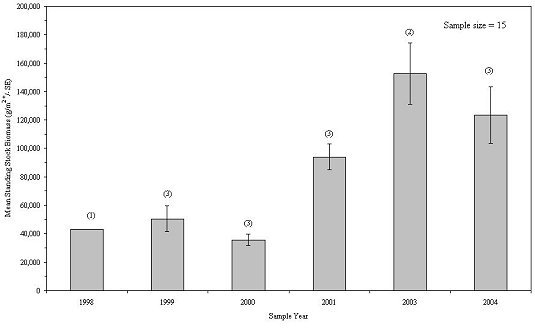
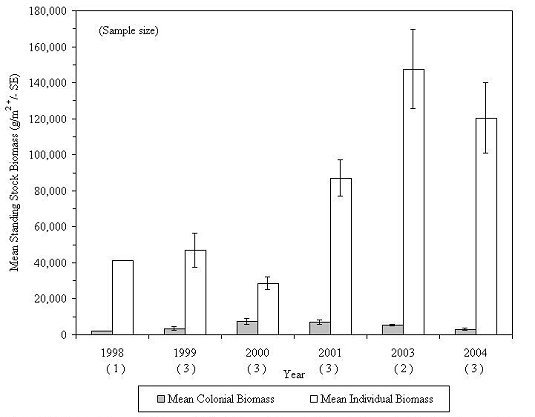
The mean standing stock biomass of all taxa inhabiting experimental reef habitats fluctuated between 35,717 and 152,802 g/m2 of unit footprint during the 6 sampling years, with 2003 showing the greatest biomass (Figure 24). Colonial organisms showed a steady increase in biomass between 1988 and 2001, then declined in abundance over the next three years, while individual organisms varied from year to year, but exhibited a general increase over the 8-year study and accounted for most of the variation in community biomass between years (Figure 25). There was little living space available for additional colonization. The habitats were so tightly packed with marine life during the 2003 and 2004 collections that the 2003 collection, which was the largest, was probably near the maximum carrying capacity of the habitat.
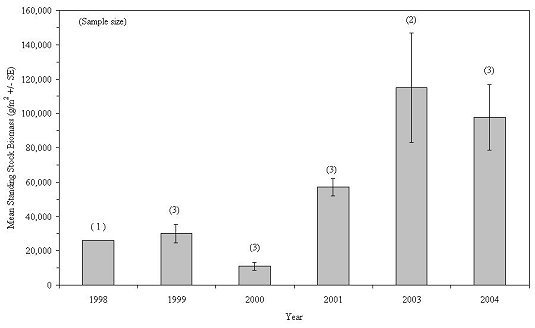
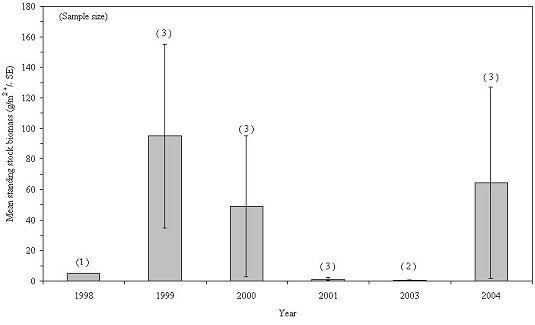
Annual variations in biomass for 9 taxa are presented in Figures 26-34. Over the 8-year study period, mollusca, annelida and echinodermata exhibited a general increase in biomass. Arthropoda biomass increased steadily during the first 5 sampling years, but declined to its lowest level in 2004. Chordata exhibited its greatest biomass during 1998-2001, declining sharply to its lowest abundance in 2004. A possible explanation for this decline is the almost complete filling of the habitats' internal spaces by blue mussels, leaving little room for free-swimming fish. Porifera biomass varied considerably from year to year, which was unexpected given this phylum's slow growth rates and long life spans. Cnidaria, ectoprocta and nemata increased in biomass during the first half of the study and then declined thereafter.


Colonization Plates
Over the 96-month study, 24 genera of sessile epibenthic invertebrates were found attached to the colonization plates, including 7 colonial and 17 individual genera. Although mobile invertebrates were also observed on the plates, they were not included in the plate analysis.
Half of the colonization plates were located on the outside of the habitats; the other half were located inside the mesh of the habitats. In terms of mean total biomass, colonization was greatest on concrete (765.8 g/m2), followed by steel (609.7 g/m2), rock (597.7 g/m2) and rubber (447.7 g/m2) (Table 4; Figure 35). For inside plates, colonization biomass was greatest on rock (3514.5 g/m2 ), followed by concrete (1548.8 g/m2), rubber (1730.1 g/m2) and steel (1220.1 g/m2). However, none of the differences between the materials of the inside plates was statistically significant (P=0.36); log transformation, ANOVA, indicating that marine life had equal success colonizing the four reef-building materials used in New Jersey (Table 5). Man-made materials (concrete, steel and rubber) were just as effective as a natural one (rock) in supporting colonization by encrusting marine life. While there was no statistically significant difference in total biomass among materials, Balanus spp. showed significantly higher biomass on rock and concrete than rubber and Bryozoa exhibited higher biomass on steel than on rubber (Table 6).
Table 4
A comparison of sessile epifaunal colonization of four common reef-building materials - concrete, rock, rubber, steel - for sampling years 1998 - 2004.
| Species | Concrete (N=29) | Rock (N=29) | Rubber (N=30) | Steel (N=30) | ||||||||
| g/m2 | SD | +/- SE> | g/m2 | SD | +/- SE | g/m2 | SD | +/- SE | g/m2 | SD | +/- SE | g/m2 |
| Colonial | ||||||||||||
| Astrangia poculata | 37.9 | 74.3 | 13.8 | 2.3 | 8.5 | 1.6 | 1.2 | 5.4 | 1.0 | 27.3 | 76.8 | 14.0 |
| Bryozoa | 60.6 | 64.9 | 12.0 | 65.1 | 85.1 | 15.8 | 30.9 | 45.5 | 8.3 | 83.9 | 71.9 | 13.1 |
| Haliclonia spp | 2.9 | 3.6 | 2.5 | <0.1 | <0.1 | <0.1 | 0.0 | 0.0 | 0.0 | <0.1 | 0.2 | <0.1 |
| Hydractinia echinata | 4.5 | 12.9 | 2.4 | 19.4 | 63.4 | 11.8 | 5.3 | 15.6 | 2.8 | 20.7 | 44.9 | 8.2 |
| Hydrozoa | 49.8 | 42.1 | 7.8 | 53.0 | 70.3 | 13.1 | 109.5 | 105.2 | 19.2 | 43.5 | 70.3 | 12.8 |
| Microciona prolifera | 0.0 | 0.0 | 0.0 | <0.1 | 0.2 | <0.1 | 0.0 | 0.0 | 0.0 | 0.0 | 0.0 | 0.0 |
| Porifera | 2.4 | 8.8 | 1.6 | 0.3 | 1.4 | 0.3 | 1.3 | 6.7 | 1.2 | 0.9 | 3.4 | 0.6 |
| Subtotal | 158.1 | 49.9 | 9.3 | 140.2 | 57.5 | 10.7 | 148.1 | 60.9 | 11.1 | 176.4 | 60.9 | 11.1 |
| Individual | ||||||||||||
| Amphitrite ornata | 0.1 | 0.2 | <0.1 | <0.1 | <0.1 | <0.1 | 11.8 | 64.3 | 11.7 | 0.1 | 0.4 | 0.1 |
| Amphitrite spp | 0.0 | 0.0 | 0.0 | 0.2 | 1.1 | 0.2 | 0.1 | 0.6 | 0.1 | 0.0 | 0.0 | 0.0 |
| Anomia simplex | <0.1 | 0.1 | <0.1 | <0.1 | <0.1 | <0.1 | 0.1 | 0.6 | 0.1 | 0.0 | 0.0 | 0.0 |
| Ascidiacea | 0.0 | 0.0 | 0.0 | <0.1 | <0.1 | <0.1 | 0.0 | 0.0 | 0.0 | 0.0 | 0.0 | 0.0 |
| Balanus spp | 184.8 | 228.9 | 42.5 | 173.1 | 328.0 | 60.9 | 55.4 | 92.9 | 17.3 | 152.2 | 232.1 | 43.1 |
| Ceriantheopsis americana | <0.1 | 0.2 | <0.1 | 0.0 | 0.0 | 0.0 | 0.0 | 0.0 | 0.0 | 0.0 | 0.0 | 0.0 |
| Clymenella torquata | 0.0 | 0.0 | 0.0 | <0.1 | <0.1 | <0.1 | 0.0 | 0.0 | 0.0 | 0.0 | 0.0 | 0.0 |
| Crepidula fornicata | <0.1 | <0.1 | <0.1 | 0.7 | 2.9 | 0.5 | 0.1 | 0.5 | 0.1 | 0.4 | 1.2 | 0.2 |
| Crepidula plana | 0.1 | 0.6 | 0.1 | 1.9 | 10.1 | 1.9 | 0.2 | 0.7 | 0.1 | 1.3 | 5.7 | 1.0 |
| Crepidula spp | 0.0 | 0.0 | 0.0 | 0.0 | 0.0 | 0.0 | 0.0 | 0.0 | 0.0 | 1.5 | 8.4 | 1.5 |
| Hydroides dianthus | 6.5 | 16.9 | 3.1 | 1.2 | 4.8 | 0.9 | 0.7 | 2.7 | 0.5 | 4.3 | 7.1 | 1.3 |
| Hydroides spp | 25.1 | 34.5 | 6.4 | 14.6 | 24.6 | 4.6 | 5.0 | 13.7 | 2.5 | 22.3 | 42.5 | 7.8 |
| Metridium senile | 420.8 | 631.8 | 117.3 | 357.0 | 594.7 | 110.4 | 299.7 | 485.7 | 88.7 | 184.1 | 306.4 | 55.9 |
| Mytilus edulis | 342.7 | 674.6 | 125.3 | 1,414.8 | 2,999.6 | 557.0 | 565.5 | 1,107.1 | 202.1 | 370.7 | 815.0 | 148.8 |
| Pseudopotamilla reniformis | 3.3 | 9.0 | 1.7 | 1.0 | 2.0 | 0.4 | 1.8 | 4.8 | 0.9 | 1.3 | 3.6 | 0.7 |
| Pseudopotamilla spp | 2.3 | 11.8 | 2.2 | 0.1 | 0.5 | 0.1 | 0.2 | 1.1 | 0.2 | 0.2 | 1.1 | 0.2 |
| Sabellaria vulgaris | 0.1 | <0.1 | <0.1 | 0.0 | 0.0 | 0.0 | 0.0 | 0.0 | 0.0 | <0.1 | <0.1 | <0.1 |
| Subtotal | 985.8 | 253.7 | 47.1 | 1, 964.7 | 786.7 | 146.1 | 940.8 | 316.1 | 57.7 | 738.4 | 230.5 | 42.1 |
| Total | 1,143.8 | 221.1 | 41.0 | 2,105.0 | 681.5 | 126.6 | 1,088.9 | 275.2 | 50.2 | 914.9 | 201.6 | 36.8 |
On the inside plates, depending on the material, individual organisms represented 91 to 97 percent of the total biomass (Table 7). In contrast, on outside plates, colonial organisms were much more abundant and represented 27 to 46 percent of the biomass (Figure 36). The combined standing stock biomass on colonization plates of all materials declined between 1998 and 2000 and then increased substantially during 2001-2004 (Figure 37). During 1998-2000, colonial invertebrates increased in biomass and then leveled off during 2001-2004. Individual invertebrates declined in biomass during 1998-2000 and then increased sharply during 2001-2004 (Figure 38).
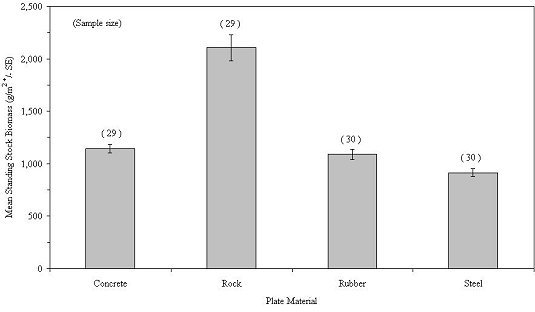
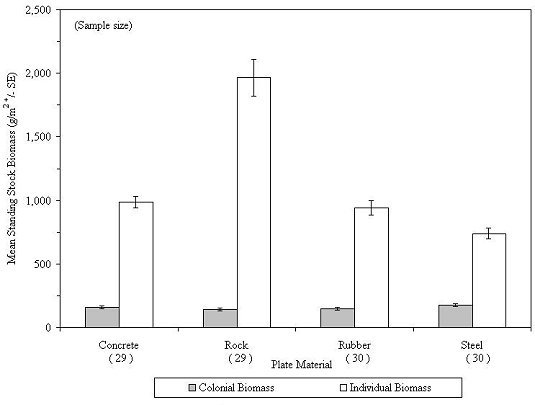
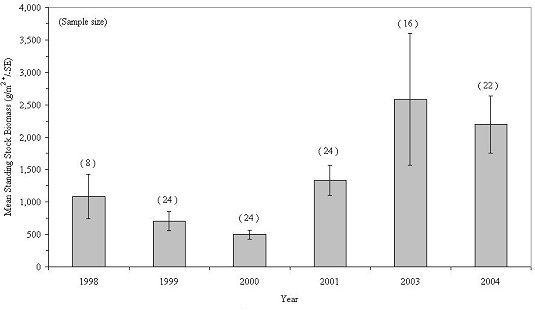

Table 5
Statistical analysis to identify significant differences in
epifaunal standing stock biomass on four reef substrates.
| Species | Non-Transformed Bartlett's Value | Logarithmic Transformed Bartlett's Value | Model p-value |
| Astrangia poculata | < 0.0001 * | 0.0719 | 0.1528 |
| Balanus sp. | 0.0007 * | 0.9665 | 0.0188 * |
| Bryozoa | 0.0281 * | 0.0178 * | 0.0068 * |
| Hydrozoa | 0.0001 * | 0.2979 | 0.0513 |
| Metridium senile | 0.0545 | N/A | 0.5090 |
| Mytilus edulis | <0.0001 * | 0.8958 | 0.5460 |
| Composite of all species | <0.0001 * | 0.1835 | 0.3528 |
* = significant results
Table 6
Statistical comparison of standing stock biomass of two species, Balanus spp. and bryozoa, that exhibited significant differences in colonization of four reef substrates.
| A. Balanus spp. (Acorn Barnacle) | ||||
| Tukey Grouping | Mean | N | Material | |
| A | 1.746 | 15 | Rock | |
| A | 1.698 | 15 | Concrete | |
| B | A | 1.4651 | 15 | Steel |
| B | 0.7691 | 15 | Rubber | |
B. Bryozoan | ||||
| Tukey Grouping | Mean | N | Material | |
| A | 1.6440 | 15 | Rock | |
| B | A | 1.1841 | 15 | Concrete |
| B | A | 1.1819 | 15 | Steel |
| B | 0.7165 | 15 | Rubber |
Tukey's multiple comparison test results. Means with the same letter are not significantly different. A.) Balanus spp. (acorn barnacle) test results indicate significantly higher colonization rates on rock and concrete than on rubber. B.) Bryozoan test results show that the rate of colonization for steel significantly higher than rubber.
Table 7
A comparison of sessile epifaunal colonization of four common reef-building materials - rubber, steel, concrete and rock - located inside and outside of a 2.5cm mesh cage, 1998-2004.
| Type | Species | Inside (N=59) | Outside (N=59) | |||||
| g/m2 | SD | +/- SE | g/m2 | SD | +/- SE | |||
| Colonial | ||||||||
| Astrangia poculata | 7.2 | 32.5 | 4.2 | 27.1 | 70.1 | 9.1 | ||
| Bryozoa | 40.6 | 50.9 | 6.6 | 79.5 | 80.9 | 10.5 | ||
| Haliclonia spp | 1.4 | 9.5 | 1.2 | 0.1 | 0.5 | 0.1 | ||
| Hydractinia echinata | 13.8 | 44.6 | 5.8 | 11.2 | 35.7 | 4.6 | ||
| Hydrozoa | 33.5 | 41.4 | 5.4 | 94.8 | 95.3 | 12.4 | ||
| Microciona prolifera | <0.1 | 0.1 | <0.1 | 0.0 | 0.0 | 0.0 | ||
| Porifera | 1.6 | 7.3 | 1.0 | 0.9 | 3.7 | 0.5 | ||
| Subtotal | 98.0 | 38.0 | 4.9 | 213.6 | 70.8 | 9.2 | ||
| Individual | ||||||||
| Amphitrite ornata | 6.1 | 45.9 | 6.0 | 0.0 | 0.0 | 0.0 | ||
| Amphitrite spp | 0.2 | 0.9 | 0.1 | 0.0 | 0.0 | 0.0 | ||
| Anomia simplex | 0.1 | 0.5 | 0.1 | <0.1 | 0.1 | <0.1 | ||
| Ascidiacea | <0.1 | <0.1 | <0.1 | 0.0 | 0.0 | 0.0 | ||
| Balanus spp | 134.5 | 219.9 | 28.6 | 147.0 | 255.7 | 33.3 | ||
| Ceriantheopsis americana | 0.0 | 0.0 | 0.0 | <0.1 | 0.1 | <0.1 | ||
| Clymenella torquata | <0.1 | <0.1 | <0.1 | 0.0 | 0.0 | 0.0 | ||
| Crepidula fornicata | 0.5 | 2.1 | 0.3 | 0.2 | 0.7 | 0.1 | ||
| Crepidula plana | 1.7 | 8.1 | 1.0 | 0.1 | 0.7 | 0.1 | ||
| Crepidula spp | 0.8 | 6.0 | 0.8 | 0.0 | 0.0 | 0.0 | ||
| Hydroides dianthus | 1.8 | 5.7 | 0.7 | 4.6 | 12.3 | 1.6 | ||
| Hydroides spp | 12.0 | 24.0 | 3.1 | 21.4 | 37.0 | 4.8 | ||
| Metridium senile | 569.5 | 612.9 | 79.8 | 58.9 | 188.5 | 24.5 | ||
| Mytilus edulis | 1184.8 | 2268.2 | 295.3 | 155.1 | 455.1 | 59.3 | ||
| Pseudopotamilla reniformis | 1.1 | 3.1 | 0.4 | 2.6 | 7.1 | 0.9 | ||
| Pseudopotamilla spp | 0.1 | 0.8 | 0.1 | 1.2 | 8.3 | 1.1 | ||
| Sabellaria vulgaris | 0.0 | 0.0 | 0.0 | <0.1 | 0.2 | <0.1 | ||
| Subtotal | 1913.1 | 627.1 | 81.6 | 391.1 | 138.6 | 18.0 | ||
| Total | 2011.1 | 542.8 | 70.7 | 604.6 | 125.3 | 16.3 |
Predation
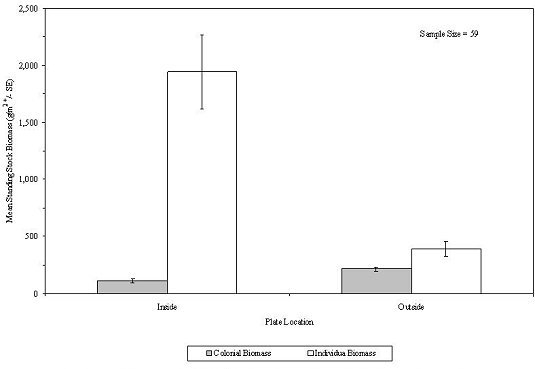
In an attempt to examine predation of the reef fouling community by large fish and crustaceans, colonization plates were located inside the mesh box and outside the mesh. The plates outside the mesh were open to predation by large, free-ranging predators; the plates inside the mesh were limited to predation from small predators living within the habitat. The data suggest that the level of predation on individual and colonial sessile epibenthos depended upon plate location. Combining all substrates over the 96-month study, the mean standing stock biomass of sessile individual epibenthos was significantly greater on the inside (1,941.7 g/m2) of the mesh as opposed to the outside (391.1 g/m2) (Student's t-test, Analysis of Means; T = 4.28; P > 0.995), suggesting that predation resulted in an 80 percent decrease in standing stock biomass (Table 7; Figure 39).
In contrast, the sessile colonial epibenthos was significantly greater (T = 4.43; P > 0.995) outside (213.6 g/m2) the mesh than inside (111.2 g/m2). The data were not collected in a manner that facilitated estimating an annual predation rate. The effects of the enclosed mesh box on water circulation, colonization of larvae, food distribution and consequent growth of epibenthos was not examined, but may have influenced these results. For individual organisms, Metridium abundance constituted the greatest disparity between inside and outside the mesh, followed by blue mussel. For the colonial epibenthos, hydroids and bryozoan made up the bulk of the difference, being much more abundant outside the mesh.
Observations
In an attempt to provide suitable habitat for a diversity of sessile and mobile invertebrates and vertebrates, the experimental habitats were designed to have a variety of substrates and a complex matrix of crevices and chambers. While the suitability of the experimental habitat probably varied among taxa and an optimum habitat was probably not achieved for any taxa, 145 identifiable taxa did use the experimental units as living space to some extent.
The wire mesh, probably because of its thin diameter and possibly its vinyl coating, did not provide a good attachment surface, except for hydroids and bryozoans.
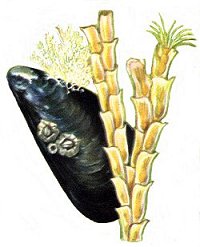
While blue mussels attached to all of the colonization plates and internal substrates, large individuals were found in the secluded crevices of the corrugated panels and whelk shells and on the inside plates. On exposed surfaces, only YOY mussels were found in large numbers. This was most likely due to predation in exposed locations. Even when tucked inside the unit, water circulation was apparently sufficient to provide the necessary flow of planktonic food to these filter feeders. The survival and growth of blue mussels resulted in the species almost completely filling the volume of the experimental habitats with little room available for additional colonization. It appears that the 2003 samples are probably near the biological carrying capacity of the habitats.
Crabs, shrimps, juvenile lobsters and small fishes used the numerous holes and chambers for seclusion. The unit's large whelk shells provided exceptionally good homes for crabs and lobster. Unfortunately, whelk shells provide only short-term habitats due to the destructive activity of boring sponge and fan worms. After 96 months, the shells exhibited structure loss and were disintegrating. The honeycomb cavities of the corrugated panels were also used by these mobile species.
Over time, the experimental habitats slowly subsided into the sandy bottom. During the last collection, the lowest few centimeters of the panels were covered by sediment. Panels buried in sediment were devoid of epibenthic growth. The presence of nemata, surf clams ( Spisula solidissima) and other sea floor denizens in later-aged collections is undoubtedly due to the subsidence of the experimental habitats and the accumulation of sediment in the lowest portions of the units.
Depending upon species, fish used the experimental habitats as cryptic living space or escape cover. Conger eel ( Conger oceanicus), radiated shanny ( Ulvaria subbifurcata) and ocean pout probably lived in small crevices and holes; cunner, tautog and black sea bass, in contrast, schooled around the periphery of the habitat, scooting inside the protective mesh when disturbed by divers. The abundance of fish declined over time. This was probably due to reduced living space inside the habitats as blue mussels increased in size and filled the volume of the experimental habitats.