Marine Life Colonization of Experimental Reef Habitat (2/5)
METHODS
The Experimental Reef Habitat Sampling Unit
The design parameters that guided the development of the experimental reef habitat sampling unit included:
- heavy base for undersea stability;
- height and width dimensions small enough to fit inside a plastic drum;
- vertical orientation to provide enough height off the bottom to obtain a true reef, rather than sand, sample;
- inside and outside attachment surfaces for 8 colonization plates;
- a variety of small cavities and cryptic spaces; and
- a screen enclosure to exclude large, predatory fish.
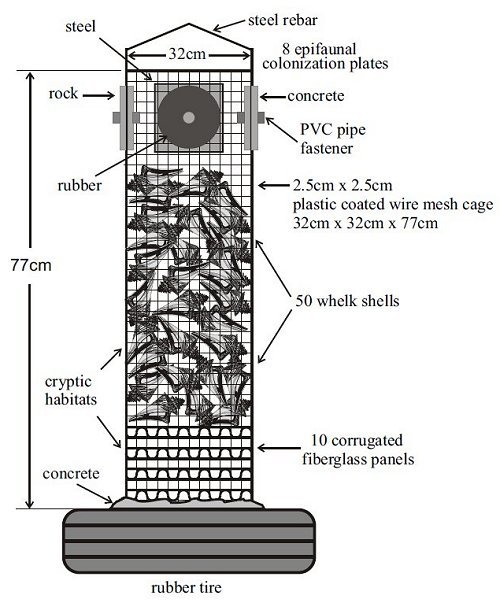
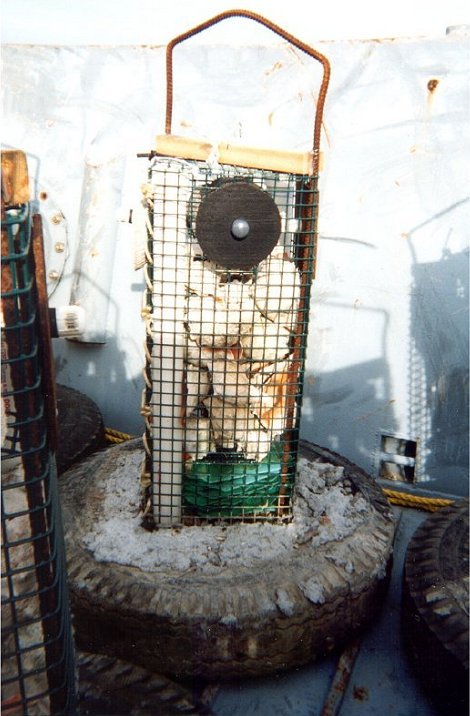
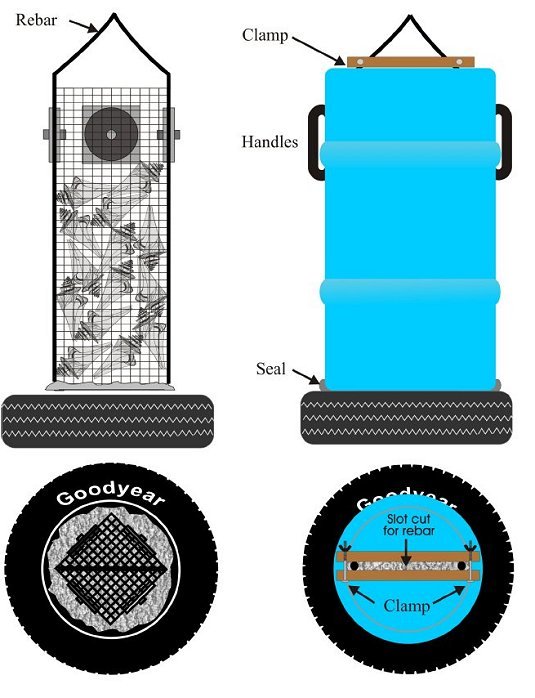
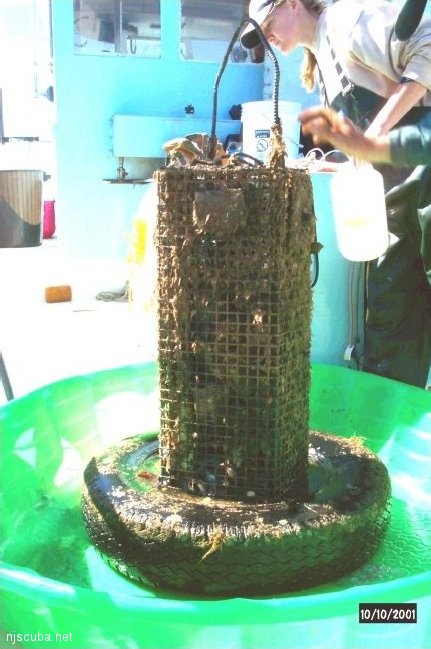
It should be noted that the experimental reef habitat was a sampling unit and did not represent any structure currently used to build reefs. Henceforth, they will be referred to as experimental reef habitats, sampling units or, simply, units. The structural components of the experimental habitat consisted of a rectangular closed box (height: 77 cm, width: 32 cm x 32 cm) constructed out of 12.5-gauge plastic-coated wire of 2.5-cm-square mesh imbedded vertically into a base made from a truck tire filled with concrete (Figures 1 and 2). The base was used only for ballast and weighed 200 to 250 kg. Vertical plastic pipes were added to ensure rigidity of the box, and a reinforcing rod was installed as a lifting eye.
Ten corrugated plastic roofing panels were placed inside the wire mesh box. Each layer was rotated 902 to produce a honeycomb effect. Approximately 50 whelk (Busycon sp.) shells were placed on top of the panels to provide a complex maze of hiding spaces, cavities and attachment surfaces.
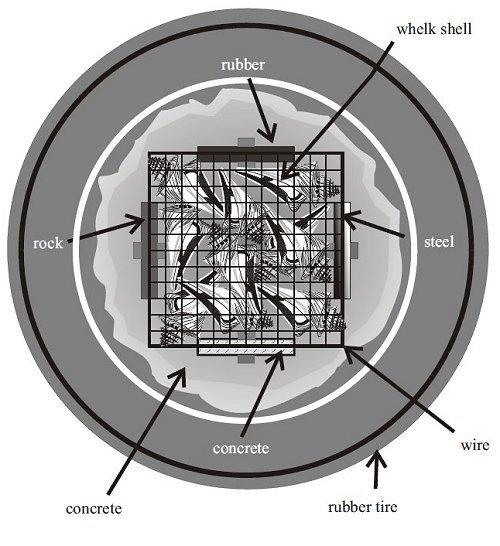
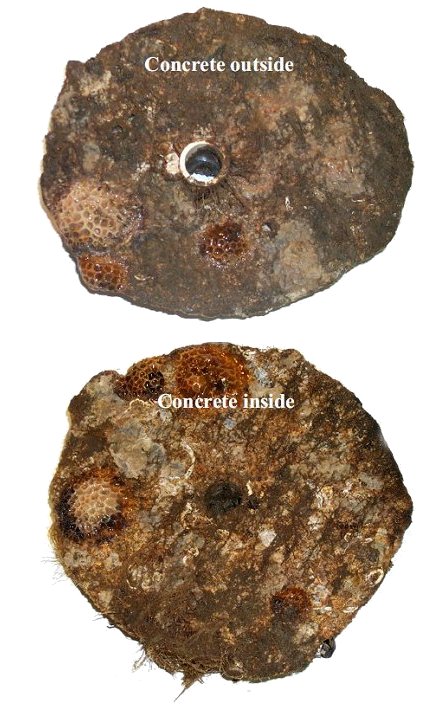
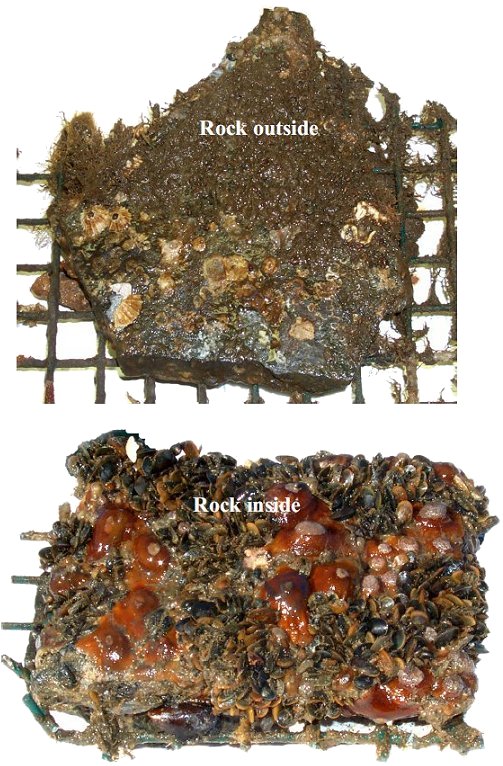
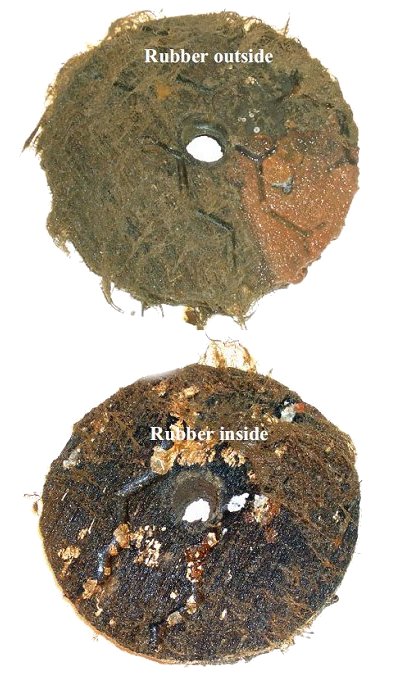
The upper portion of the box consisted of a hollow chamber completely enclosed by the wire mesh. Two plates each of four different materials - rubber, concrete, steel and rock - were attached back to back to the upper chamber of the box, with one plate outside and one plate inside the mesh (Figure 3). The plates represented four common reef-building materials and served as colonization substrates for sessile epifauna. The plates on the outside of the wire cage were open to predation from large fish and invertebrates; those inside the cage were protected from large predators, although some crabs that established themselves as juveniles within the unit did grow to adult size and were trapped within the cage.
The experimental habitats have a mean height of 77.3 cm, a sea floor footprint of 1,034 cm2 and encompass a volume of 79,609 cm2 (Table 1). The wire cage itself has a mean surface area of 8,626 cm2, although this attachment surface consists of small diameter (0.3cm) wire. The fiberglass panels (top and bottom) have a combined surface area of 14,855 cm2. The whelk shells (inside and outside shell surfaces) have an approximate total surface area of 22,730 cm2. For the colonization plates, only the exposed flat surface and edge were measured, the back-to-back surfaces were not counted.
The colonization plates have the following mean surface areas: concrete = 1,053 cm2; steel = 776 cm2; tire = 572 cm2; rock = 574 cm2. The mean total area of attachment surfaces for the entire habitat is 49,186 cm2. Therefore, each experimental reef habitat provides an increase in surface area of 47.6 times that represented by the sea floor footprint of the habitat. In comparison, a solid block the same height as the experimental habitat would have a surface area to footprint ratio of 10.6. Thus, the experimental habitat provided a complex, cryptic habitat with extensive surface area available to biological colonization.
Table 1
Mean dimensions of 10 experimental reef habitats, 1998-2001.
| Parameter | Unit | Mean | SD |
| Sea Floor Footprint | cm2 | 1,034 | 64 |
| Habitat Volume | cm2 | 79,609 | 6,608 |
| Wire Cage Area | cm2 | 8,626 | 430 |
| Fiberglass Panel Area | cm2 | 14,855 | 1,566 |
| Whelk Shell Area | cm2 | 22,730 | 3,130 |
| Concrete Plate Area | cm2 | 1,053 | 93 |
| Steel Plate Area | cm2 | 776 | 26 |
| Tire Plate Area | cm2 | 572 | 42 |
| Rock Plate Area | cm2 | 574 | 70 |
| Total Habitat Area | cm2 | 49,186 | 4,217 |
Study Site
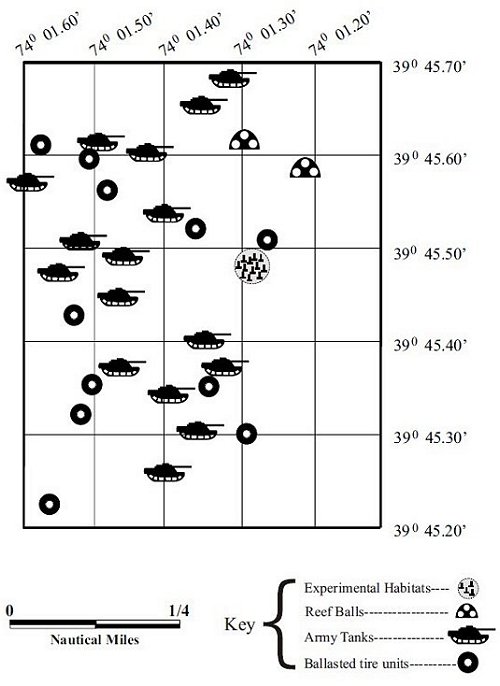
The study site was the Barnegat Light Reef Site. This site is located in the northwestern Atlantic Ocean, 3 nm offshore of Barnegat Light, NJ. The depth is 17m. The sea floor consists of coarse sand, gravel and pebbles. Reef structures placed on the site include concrete-ballasted tire units, Reef Ball concrete habitats, hollow concrete castings, obsolete army tanks and 3 small steel vessels (Figure 4). As of 2004, the total volume of reef structure on this site is 7,532 m2; the total footprint of reef structure is 7,375 m2.
Deployment
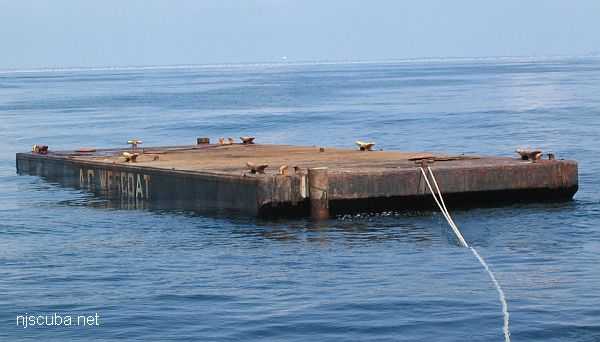
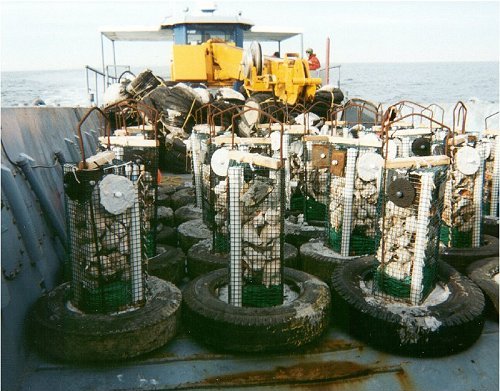
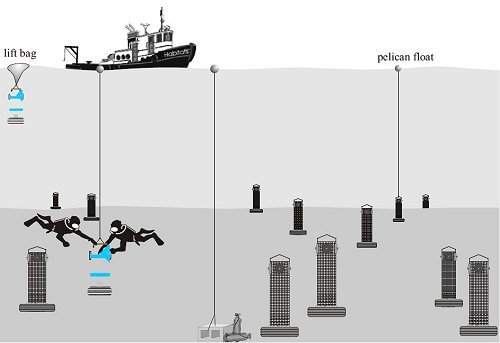
In October 1996, 30 experimental reef habitat sampling units were placed on the study site from a motorized barge operated by the Ocean County Bridge Department (Figure 5). After the barge was anchored, the experimental habitats were individually lowered to the sea floor using a tether line and submersible float equipped with a release hook. This was done to ensure that the units landed upright. The units were spaced apart in a group about 30 m in diameter (Figure 6).
Retrieval
In October of each year, experimental habitats were retrieved by divers. Each of these units was quickly enclosed within a plastic drum which sealed against the tire base (Figure 7) to trap the organisms inside. Once enclosed, each unit was raised to the surface using an inflatable lift bag. The unit was then lifted into the boat using an electric winch and davit and placed inside a plastic tub (Figures 8 and 9). After removing the drum, the wire mesh was cut open with wire cutters (Figures 10-12). The following items were removed and inserted into resealable, 10-liter plastic bags: 8 colonization plates, 2 fiberglass panels, 5 whelk shells (Figure 13), and a sample of wire mesh.
The sample panels and whelk shells were randomly selected. The remaining sand, gravel, shell hash and other debris were scraped off what remained of the box and deposited into the tub. During unit breakdown, large organisms (>3 cm), such as crabs, lobsters and fish were removed and placed in plastic, 5-liter jars filled with 10 percent formalin solution. The contents of the tub were rinsed through a 0.5-mm mesh sieve and bagged as bulk samples. All samples, with the exception of the samples in formalin, were stored on ice in coolers for transport back to the lab, where they were frozen.


Lab Analysis
Various techniques were employed to examine and remove organisms from the different components of the unit. Whelk shells were measured for length, then cut in half with a miter saw equipped with a 2 mm-wide masonry blade to expose the inside of the shell. The shells and the fiberglass panels were analyzed in a similar fashion. All mobile invertebrates and sessile, individual organisms, such as anemones and mussels, were removed, sorted by species, counted, weighed in aggregate, and measured. In 1998 and 1999, weights were measured to the nearest 0.1g on a triple beam balance. From 2000 on, weights were measured to the nearest 0.001g on an electronic balance. All weights were reported as damp weights that included shell. Live barnacles and tubeworms were counted, and when possible, removed and weighed. The surface areas covered by colonial, encrusting bryozoan, hydroid, stone coral and sponge colonies were estimated using sheets of clear plastic printed with a 1-cm-square grid. Due to their fragility, most hydroid colonies did not withstand the freezing and thawing process well enough to do more than obtain weights. The percent area of coverage of the wire mesh by encrusting colonies was estimated visually in increments of 25 percent for each 2.5 cm wire segment.
All of the preceding types of samples were then individually rinsed into a 0.5mm mesh sieve along with residual contents left inside each sample's collection bag. The contents of the sieve were then placed under a dissecting microscope to sort, identify, count, and measure the additional mobile invertebrates for each sample.
Colonization plates were sorted individually (Figures 14-16). First, all large mobile organisms were removed for later analysis. Second, the percent coverage of plate surface area by colonial species was estimated using the 1-cm-square grid. Third, attached sessile, individual organisms, such as anemones, tubeworms, barnacles, slipper shells ( Crepidula spp.), mussels ( Mytilus edulis), and jingle shells ( Anomia sp.), were counted. These organisms (when possible to remove in their entirety) were then weighed. Only the organisms found on the exposed surfaces of the plates, i.e. tops and sides, were collected for analysis. Each plate and the contents of the bag containing it were then rinsed into a 0.5-mm sieve to retrieve any remaining mobile organisms for later analysis.
The samples of the large animals extracted and placed in formalin and the mobile invertebrates taken from the colonization plates were independently speciated, counted, weighed and measured. Since these bulk samples proved to be too large to sort and quantify in their entirety, the following procedure was used to obtain random subsamples of at least 10 percent by weight for each unit: First, the sample was weighed; second, the sample was thoroughly mixed and spread to an even depth on a tray; third, a spatula was used to scoop subsamples from randomly chosen locations on the tray; fourth, the subsample was weighed, speciated and enumerated following the same procedures used for the preceding samples.
Samples of certain attached or encrusting taxa, such as barnacles, bryozoans, hydroids, stone corals ( Astrangia astrelformis) and sponges, were removed and weighed to determine a per unit weight, by number for barnacles, and by area for the colonial encrusting organisms. The total weights of these taxa were estimated, by expanding per unit weights to the total number for barnacles and the total surface area for colonial invertebrates.
Length frequencies by species were obtained by measuring individuals to the nearest mm as follows: fishes (total length); crabs (carapace width); lobster ( Homarus americanus) (rostrum to tail length); and blue mussel (shell length).
Statistical Analysis
The statistical comparison of colonization plates involved using Bartlett's Test for Homogeneity to determine if treatment variances were uniform. Non-parametric, non-uniform data was log transformed before running ANOVA. For species that exhibited statistically significant differences in biomass among the various plate materials, a Tukey's Multiple Comparison Test was conducted.