Artificial Reefs Siting (2/2)
NEW JERSEY DEPARTMENT OF ENVIRONMENTAL PROTECTION
DIVISION OF FISH AND WILDLIFE
MARINE FISHERIES ADMINISTRATION
BUREAU OF MARINE FISHERIES
Date Submitted: March 2003
Period of Study: 1973 through 2002
Reported by: Bill Figley
Data Compilation & Summarization: Jennifer Daetsch
This Job, "Coordination of Artificial Reef Construction, " was conducted under Grant F-69-D and supported in part by Wallop-Breaux Federal Aid to Sportfish Restoration Funds administered by the U.S. Fish and Wildlife Service. #6dploy02
Annual Data Summary
Summary of Reef Materials Deployed through 2002
Initial Construction
The following report summarizes reef construction activities on New Jersey's fourteen artificial reef sites. Between 1973 and 1983, materials were deployed by a private group, called the "Artificial Reef Committee", working in cooperation with the Sandy Hook Lab of the National Marine Fisheries Service. During that time, the Committee deployed seven vessels, encompassing 17,213 cubic yards, and 400 cubic yards of steel drums on the Sea Girt Reef ( Table 1. )
Number of Deployments
In 1984, the New Jersey Division of Fish and Wildlife took over all reef-building efforts in the state. Since the inception of the Division's program, reef construction has increased steadily ( Table 1. ) In 19 years, a total of 2,093 "patch" reefs were constructed. A patch reef is a several-square-yard to several-acre reef created by placing a vessel or army tank or barge-load of other material on the seafloor. About 13 percent of these reefs, 271 in number, were made in 2002.
Volume of Materials
During 2002, a total of 658,438 cubic yards of material was deployed on reef sites ( Table 1 ) including 634,176 cubic yards of rock, 11,830 cubic yards of concrete, 10,389 cubic yards of vessels, 1,018 cubic yards of concrete castings, 883 cubic yards of Reef Balls and 142 cubic yards of ocean cable. Over the last 19 years, a total of 3,301,892 cubic yards of material has been deployed on New Jersey's 14 reef sites, including 2,700,393 cubic yards of rock, 285,459 cubic yards of vessels, 229,365 cubic yards of concrete, 61,772 cubic yards of concrete-ballasted tire units and 17,853 cubic yards of obsolete army tanks. The distribution of material by reef site is shown in Table 2.
Tire Reef Program
The total production of concrete-ballasted tire units was 55,713 units during the 15-year cooperative tire reef program ( Table 4. ) the use of concrete-ballasted tire units was discontinued in 1998.
REEFEX
REEFEX began in 1994 as a joint military-civilian training program whereby the U.S. Navy, Coast Guard, Army and Navy Special Forces, Air Force, and New Jersey Army National Guard participated in providing obsolete military vehicles for reef construction activities. Tanks were cleaned and prepared at Fort Dix by the New Jersey Army National Guard. During the 6-year program, a total of 397 obsolete army vehicles were placed on 11 reef sites. The program ended in 1999 due to insufficient funding.

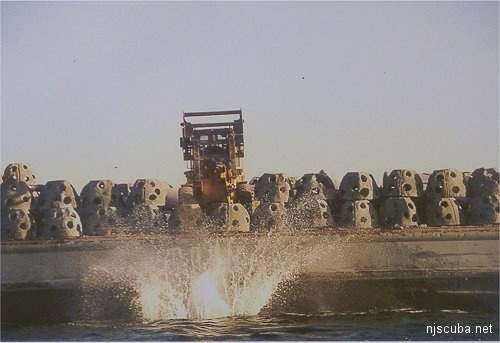
Reef Ball Habitats
In 1998, 16 fiberglass molds were purchased to fabricate concrete Reef Ball habitats. In 1999, construction of habitats began at Southern State Correctional Facility using inmate laborers. The program is designed to produce 700 habitats each year. Transportation of the habitats to ocean reef sites was provided by the Ocean County Bridge Department and now, by a contractor. In 2002, 650 habitats were placed on 5 reef sites. To date, a total of 2,556 Reef Ball habitats have been placed on 6 reef sites ( Table 4. )
Concrete Castings
Concrete castings is a new category of reef material in 2002. Concrete castings are pipes, junction boxes, and other hollow concrete structures with manufacturer's defects, like chips or cracks, that render them unsaleable. In 2002, 447 concrete castings were placed on two reef sites: Little Egg and Cape May.
Sea Floor Coverage
The seafloor coverage by reef structure is an important measurement of habitat for demersal fish and shellfish. The total area of seafloor that has been covered by reef materials over the past 19 years is 1,887,159 square yards ( Table 3. ) Rock, concrete and concrete-ballasted tire units provide the majority of the surface coverage due to their low height. The high relief of ships leads to large volumes, but low footprint coverage.
Material Relief
The majority of material in terms of footprint ( area of seafloor covered ) has been moderately low ( 4-7' ) and low ( 0'-3' ) structures, with smaller amounts of moderately high ( 8'-12' ) and high profile ( over 12' ) structures. While the aim of the reef project is to create low profile structure that provides the greatest benefits for targeted reef species, such as sea bass, tautog, scup, and red hake, a mix that includes high profile material provides habitat for pelagic species, such as bluefish, bonito, jacks, and various baitfish. It should be noted that the lower portions of high profile structures also provide low profile habitat.
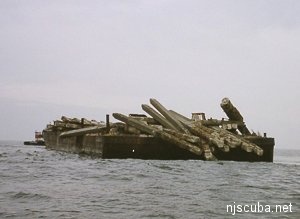
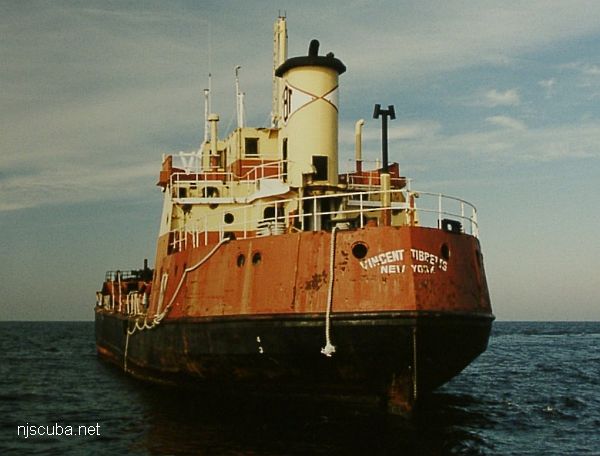
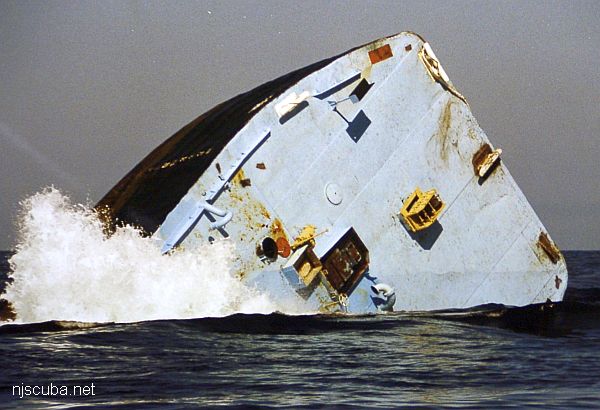
Vessels
Since 1973, a total of 122 vessels ( Table 5 ) have been sunk, with 115 by the Division of Fish and Wildlife. The vessels range in size from a 31-foot steel sport boat to a 460-foot Navy attack cargo transport. The Sea Girt, Garden State North, Atlantic City, and Cape May reefs have received the largest numbers of vessels ( Table 5. )
The vessels sunk during 2002 include:
- Wedding Barge ( 109' deck barge )
- Tuna Sub ( 42' deck barge )
- Southwick's Barge ( 62' deck barge )
- BassBarn.com ( 224' tanker barge )
- Capt. Walt Hendee ( 244' tanker )
Reef Site Coverage
New Jersey's fourteen reef sites comprise over 99 million square yards of seafloor ( Table 14. ) By the end of 2002, the area of seafloor covered by all materials deployed on reef sites amounted to 1,887,159 square yards. Thus, reef material is now covering only about 1.90 percent of the state's 14 reef sites; 98.10 percent of the ocean bottom on these sites is still not covered with reef structure but remains as sand.
Acknowledgements
Personnel involved in the deployment of reef materials during 2002 included Jeff Carlson, Barry Preim, Linda Barry, Jennifer Daetsch, Nathan Figley, and John Makai. Data compilation and summarization was performed by Jennifer Daetsch. The manuscript was typed by Nancy Loveland.
Table 1
Number of Patch Reefs Deployed By Year
| Year | Concrete | Rock | Tire Units | Vessels | Tanks | Reef Balls | Other | TOTAL |
| 1984 | 1 | 1 | 2 | |||||
| 1985 | 1 | 2 | 5 | 8 | ||||
| 1986 | 6 | 8 | 14 | |||||
| 1987 | 8 | 8 | 6 | 22 | ||||
| 1988 | 19 | 29 | 6 | 54 | ||||
| 1989 | 8 | 32 | 9 | 49 | ||||
| 1990 | 7 | 7 | 24 | 6 | 1 | 45 | ||
| 1991 | 22 | 58 | 33 | 5 | 1 | 119 | ||
| 1992 | 52 | 148 | 24 | 3 | 227 | |||
| 1993 | 3 | 148 | 15 | 7 | 173 | |||
| 1994 | 11 | 29 | 19 | 9 | 6 | 3 | 77 | |
| 1995 | 34 | 9 | 5 | 58 | 1 | 107 | ||
| 1996 | 2 | 22 | 5 | 77 | 1 | 107 | ||
| 1997 | 1 | 2 | 5 | 10 | 84 | 102 | ||
| 1998 | 5 | 5 | 4 | 116 | 130 | |||
| 1999 | 5 | 2 | 56 | 15 | 78 | |||
| 2000 | 4 | 34 | 20 | 58 | ||||
| TOTAL | 178 | 392 | 228 | 95 | 397 | 49 | 33 | 1372 |
Table 2
Volume of Materials Deployed in 2000
by Artificial Reef Site ( cubic yards )
| Reef Site | Concrete | Rock | Reef Balls | Vessels | Tanks | Other * | TOTAL |
| Sandy Hook | 0 | ||||||
| Shark River | 0 | ||||||
| Sea Girt | 6457 | 6457 | |||||
| Axel Carlson | 169 | 1086 | 1255 | ||||
| Barnegat Light | 161 | 161 | |||||
| Garden State N | 80 | 80 | |||||
| Garden State S | 167 | 167 | |||||
| Little Egg | 0 | ||||||
| Atlantic City | 474 | 474 | |||||
| Great Egg | 0 | ||||||
| Ocean City | 0 | ||||||
| Wildwood | 0 | ||||||
| Cape May | 517 | 517 | |||||
| Deepwater | 0 | ||||||
| TOTAL | 0 | 0 | 577 | 8060 | 0 | 474 | 9111 |
* includes steel drums, railroad cars, cable
Table 3
Volumes of Materials From All Sources Deposited on
Reef Sites by Year Through 2000 ( cubic yards )
| Year | Concrete | Rock | Tire Units | Vessels | Tanks | Reef Balls | Other | TOTAL |
| 1983 | 17213 | 400 | 17613 | |||||
| 1984 | 1100 | 170 | 1270 | |||||
| 1985 | 2000 | 1050 | 15879 | 18929 | ||||
| 1986 | 2210 | 20966 | 104 | 23280 | ||||
| 1987 | 10400 | 2647 | 14912 | 27959 | ||||
| 1988 | 33272 | 3480 | 12248 | 49000 | ||||
| 1989 | 7110 | 3622 | 11712 | 22444 | ||||
| 1990 | 10687 | 4800 | 5360 | 9311 | 1100 | 31258 | ||
| 1991 | 20576 | 200705 | 6606 | 54392 | 2302 | 284581 | ||
| 1992 | 33050 | 671690 | 7110 | 4320 | 400 | 716570 | ||
| 1993 | 5000 | 716500 | 6501 | 7680 | 672 | 736353 | ||
| 1994 | 8400 | 145000 | 11729 | 18185 | 600 | 64 | 183978 | |
| 1995 | 58625 | 5557 | 3683 | 2540 | 70405 | |||
| 1996 | 650 | 4169 | 6412 | 3847 | 766 | 15844 | ||
| 1997 | 45 | 3450 | 1023 | 22545 | 3859 | 30922 | ||
| 1998 | 3275 | 250 | 11476 | 4571 | 19572 | |||
| 1999 | 3810 | 4596 | 2122 | 575 | 11103 | |||
| 2000 | 8060 | 577 | 474 | 9111 | ||||
| TOTAL | 196900 | 1742145 | 62414 | 243760 | 17539 | 1152 | 6282 | 2270192 |
Table 4
Volumes of Materials From All Sources Deployed
on Artificial Reefs Through 2000 ( cubic yards )
| Reef Site | Concrete | Rock | Tire Units | Vessels | Tanks | Reef Balls | Other | TOTAL |
| Sandy Hook | 100372 | 1742145 | 751 | 44 | 1843312 | |||
| Shark River | 26800 | 597 | 75258 | 102655 | ||||
| Sea Girt | 39495 | 47908 | 1318 | 2160 | 90881 | |||
| Axel Carlson | 438 | 8109 | 2185 | 169 | 10901 | |||
| Barnegat Light | 2273 | 178 | 2464 | 490 | 20 | 5425 | ||
| Garden State N | 4536 | 30527 | 1127 | 326 | 36516 | |||
| Garden State S | 4835 | 4788 | 1257 | 167 | 11047 | |||
| Little Egg | 200 | 2057 | 1412 | 1544 | 106 | 5319 | ||
| Atlantic City | 5281 | 45103 | 1460 | 1276 | 53120 | |||
| Great Egg | 7893 | 3208 | 1939 | 13040 | ||||
| Ocean City | 4762 | 3668 | 1634 | 104 | 10168 | |||
| Wildwood | 500 | 6525 | 508 | 1591 | 9124 | |||
| Cape May | 29533 | 19332 | 22343 | 1020 | 2572 | 74800 | ||
| Deepwater | 3885 | 3885 | ||||||
| TOTAL | 196900 | 1742145 | 62414 | 234760 | 17539 | 1152 | 6282 | 2270193 |
Table 5
Number of Tire Units Constructed and Deployed by
Carbon Service Corporation and Ocean, Atlantic and Cape May Counties Cooperative Tire Reef Programs
| YEAR | TIRE UNIT PRODUCTION |
| 1984 | 380 |
| 1985 | 700 |
| 1986 | 2203 |
| 1987 | 2647 |
| 1988 | 3480 |
| 1989 | 3347 |
| 1990 | 5278 |
| 1991 | 7382 |
| 1992 | 6429 |
| 1993 | 4879 |
| 1994 | 9327 |
| 1995 | 4714 |
| 1996 | 3854 |
| 1997 | 712 |
| 1998 | 313 |
| TOTAL | 55645 |
Table 6
Numbers and Types of Military Vehicles
Deployed Through REEFEX by Year
| YEAR | M-113 APC* | M-551 Sheridan | M-60 tank | M-578 tow vehicle | TOTAL |
| 1994 | 6 | 6 | |||
| 1995 | 40 | 8 | 10 | 58 | |
| 1996 | 24 | 43 | 10 | 77 | |
| 1997 | 21 | 1 | 62 | 84 | |
| 1998 | 97 | 4 | 13 | 2 | 116 |
| 1999 | 41 | 4 | 11 | 56 | |
| TOTAL | 202 | 76 | 44 | 75 | 397 |
* Armored Personnel Carrier
Table 7
Numbers and Types of Military Vehicles Deployed
Through REEFEX by Reef Site Through 2000
| Reef Site | M-113 APC* | M-551 Sheridan | M-60 tank | M-578 tow vehicle | TOTAL |
| Sandy Hook | |||||
| Shark River | |||||
| Sea Girt | 19 | 6 | 1 | 26 | |
| Axel Carlson | 36 | 2 | 9 | 1 | 48 |
| Barnegat Light | 41 | 6 | 5 | 12 | 64 |
| Garden State N | 26 | 5 | 1 | 32 | |
| Garden State S | 24 | 5 | 2 | 2 | 33 |
| Little Egg | 5 | 6 | 25 | 36 | |
| Atlantic City | 2 | 8 | 6 | 9 | 25 |
| Great Egg | 13 | 5 | 19 | 37 | |
| Ocean City | 8 | 18 | 2 | 6 | 34 |
| Wildwood | 7 | 13 | 8 | 28 | |
| Cape May | 34 | 34 | |||
| Deepwater | |||||
| TOTAL | 202 | 76 | 44 | 75 | 397 |
* Armored Personnel Carrier
Table 8
Number of Reef Ball Habitats
Deployed by Reef Site Through 2000
Reef Site | Total Number of Reef Balls |
| Axel Carlson | 200 |
| Barnegat Light | 591 |
| Garden State N | 408 |
| Garden State S | 200 |
| TOTAL | 1399 |
Table 9
Sea Floor Coverage of Materials Deployed in
2000 by Artificial Reef Site ( square yards )
| Reef Site | Concrete | Rock | Reef Balls | Vessels | Tanks | Other* | TOTAL |
| Sandy Hook | 0 | ||||||
| Shark River | 954 | 954 | |||||
| Sea Girt | 0 | ||||||
| Axel Carlson | 296 | 217 | 513 | ||||
| Barnegat Light | 282 | 282 | |||||
| Garden State N | 140 | 140 | |||||
| Garden State S | 292 | 292 | |||||
| Little Egg | 0 | ||||||
| Atlantic City | 9310 | 9310 | |||||
| Great Egg | 0 | ||||||
| Ocean City | 0 | ||||||
| Wildwood | 0 | ||||||
| Cape May | 157 | 157 | |||||
| Deepwater | 0 | ||||||
| TOTAL | 0 | 0 | 1010 | 1328 | 0 | 9310 | 11648 |
* includes steel drums, railroad cars and cable
Table 10
Sea Floor Coverage of Materials From All Sources
on Artificial Reefs Through 2000 ( square yards )
| Reef Site | Concrete | Rock | Tire Units | Vessels | Tanks | Reef Balls | Other * | TOTAL |
| Sandy Hook | 123967 | 877584 | 442 | 67 | 1002060 | |||
| Shark River | 12170 | 771 | 314 | 20255 | ||||
| Sea Girt | 43610 | 12121 | 556 | 1525 | 57812 | |||
| Axel Carlson | 438 | 1760 | 926 | 297 | 3421 | |||
| Barnegat Light | 3245 | 89 | 1106 | 1239 | 20 | 5699 | ||
| Garden State N | 6035 | 6247 | 510 | 571 | 1202 | 14565 | ||
| Garden State S | 4866 | 1511 | 556 | 289 | 7222 | |||
| Little Egg | 200 | 1412 | 529 | 733 | 53 | 2927 | ||
| Atlantic City | 6471 | 7015 | 558 | 14110 | 28154 | |||
| Great Egg | 7332 | 642 | 785 | 8759 | ||||
| Ocean City | 5300 | 1053 | 660 | 124 | 7137 | |||
| Wildwood | 250 | 7998 | 218 | 571 | 9037 | |||
| Cape May | 41817 | 23290 | 5364 | 510 | 1533 | 72514 | ||
| Deepwater | 4990 | 4990 | ||||||
| TOTAL | 222014 | 877584 | 72148 | 44305 | 7472 | 2396 | 18635 | 1244554 |
* includes steel drums, cable, subway cars and other steel structures
Table 11
Sea Floor Coverage of All Materials on Artificial Reefs Broken Down by Relief Off the Bottom and Reef Site Through 2000 ( square yards )
| Reef Site | Relief 0' - 3' | Relief 4' - 7' | Relief 8' - 12' | Relief over 12' |
| Sandy Hook | 120404 | 879734 | 1923 | |
| Shark River | 771 | 12170 | 7314 | |
| Sea Girt | 34995 | 9969 | 9214 | 3694 |
| Axel Carlson | 35 | 40 | 1670 | 476 |
| Barnegat Light | 4504 | 51 | 544 | |
| Garden State N | 7308 | 1277 | 690 | 5291 |
| Garden State S | 4648 | 967 | 1607 | |
| Little Egg | 1616 | 128 | 1086 | 101 |
| Atlantic City | 14707 | 3054 | 4277 | 6117 |
| Great Egg | 4529 | 2803 | 785 | 642 |
| Ocean City | 5300 | 483 | 1354 | |
| Wildwood | 7998 | 588 | 451 | |
| Cape May | 25290 | 41544 | 1350 | 4330 |
| Deepwater | 4990 | |||
| TOTAL | 237791 | 953907 | 25698 | 27905 |
Table 12
Number and Type of Vessels Sunk on New Jersey
Artificial Reefs by Year Through 2000
| Vessel Type | 73-83* | 84 | 85 | 86 | 87 | 88 | 89 | 90 | 91 | 92 | 93 | 94 | 95 | 96 | 97 | 98 | 99 | 00 | TOTAL |
| Barge | 1 | 1 | 1 | 2 | 6 | 1 | 1 | 1 | 4 | 1 | 1 | 4 | 1 | 1 | 26 | ||||
| Commercial Fishing | 3 | 1 | 1 | 3 | 2 | 2 | 2 | 1 | 1 | 16 | |||||||||
| Crew Boat | 1 | 1 | 2 | ||||||||||||||||
| Dry Dock | 1 | 1 | |||||||||||||||||
| Ferry | 1 | 1 | |||||||||||||||||
| Freighter | 1 | 1 | 1 | 1 | 4 | ||||||||||||||
| Landing Craft | 1 | 1 | 2 | ||||||||||||||||
| Mold | 2 | 2 | 2 | 6 | |||||||||||||||
| Schooner | 1 | 1 | |||||||||||||||||
| Sport Boat | 1 | 1 | 1 | 3 | |||||||||||||||
| Tanker | 1 | 1 | 1 | 3 | 1 | 1 | 1 | 2 | 1 | 1 | 3 | 1 | 17 | ||||||
| Tug | 2 | 2 | 2 | 2 | 1 | 3 | 2 | 3 | 2 | 19 | |||||||||
| Coast Guard | 2 | 2 | 1 | 1 | 6 | ||||||||||||||
| Lightship | 1 | 1 | |||||||||||||||||
| Sailboat | 1 | 1 | 2 | ||||||||||||||||
| TOTAL | 5 | 1 | 5 | 6 | 7 | 6 | 14 | 7 | 4 | 3 | 7 | 9 | 8 | 5 | 10 | 4 | 2 | 4 | 107 |
* vessels sunk by Artificial Reef Committee
Table 13
Number and Type of Vessels Sunk by
Artificial Reef Site Through 2000
| Reef Site -- See below for key | |||||||||||||||
| Vessel Type | SH | SR | SG | CAR | BL | GSN | GSS | LE | AC | GE | OC | WW | CM | DW | TOTAL |
| Barge | 1 | 10 | 2 | 3 | 2 | 1 | 1 | 3 | 1 | 2 | 26 | ||||
| Commercial Fishing | 4 | 1 | 5 | 1 | 5 | 16 | |||||||||
| Crew Boat | 1 | 1 | 2 | ||||||||||||
| Dry Dock | 1 | 1 | |||||||||||||
| Ferry | 1 | 1 | |||||||||||||
| Freighter | 1 | 1 | 2 | 4 | |||||||||||
| Landing Craft | 2 | 2 | |||||||||||||
| Boat Mold | 1 | 2 | 3 | 6 | |||||||||||
| Schooner | 1 | 1 | |||||||||||||
| Sport Boat | 2 | 1 | 3 | ||||||||||||
| Tanker | 1 | 5 | 3 | 3 | 2 | 1 | 2 | 17 | |||||||
| Tug | 1 | 2 | 6 | 2 | 1 | 3 | 3 | 1 | 19 | ||||||
| Coast Guard | 2 | 4 | 6 | ||||||||||||
| Lightship | 1 | 1 | |||||||||||||
| Sailboat | 1 | 1 | 2 | ||||||||||||
| TOTAL | 4 | 8 | 26 | 4 | 2 | 12 | 8 | 2 | 15 | 1 | 7 | 1 | 17 | 0 | 107 |
Key:
| SH - SR - SG - CAR - BL - GSN - GSS - | Sandy Hook Shark River Sea Girt Axel Carlson Barnegat Light Garden State North Garden State South | LE - AC - GE - OC - WW - CM - DW - | Little Egg Atlantic City Great Egg Ocean City Wildwood Cape May Deepwater |
Table 14
Percent Coverage of Reef Sites by Reef
Structures Through 2002 ( square yards )
| Reef Site | Area ( square yards ) | Reef Structure ( square yards ) | Reef Structure | Open Bottom |
| Sandy Hook | 5,788,222 | 1,298,948 | 22.44% | 77.56% |
| Shark River | 2,067,222 | 340,976 | 16.49% | 83.51% |
| Sea Girt | 5,373,777 | 63,116 | 1.17% | 98.83% |
| Axel Carlson | 16,537,716 | 6,267 | 0.04% | 99.96% |
| Barnegat Light | 3,514,277 | 5,981 | 0.17% | 99.83% |
| Garden State North | 4,547,888 | 14,566 | 0.32% | 99.68% |
| Garden State South | 2,273,944 | 7,711 | 0.33% | 99.67% |
| Little Egg | 5,600,000 | 4,057 | 0.07% | 99.93% |
| Atlantic City | 16,537,776 | 32,677 | 0.20% | 99.80% |
| Great Egg | 3,307,555 | 8,931 | 0.27% | 99.73% |
| Ocean City | 3,142,177 | 15,343 | 0.49% | 99.51% |
| Cape May | 18,604,998 | 72,367 | 0.39% | 99.61% |
| Wildwood | 8,806,366 | 9,280 | 0.11% | 99.89% |
| Deepwater | 2,976,800 | 6,939 | 0.23% | 99.77% |
| TOTAL | 99,078,718 | 1,887,159 | 1.90% | 98.10% |
Photographs added by editor - NJScuba,net